ATTENTION:
It appears that you do not have
JavaScript
enabled.
Therefore, some features of this site will not display correctly.
Did you know
Political Factoid
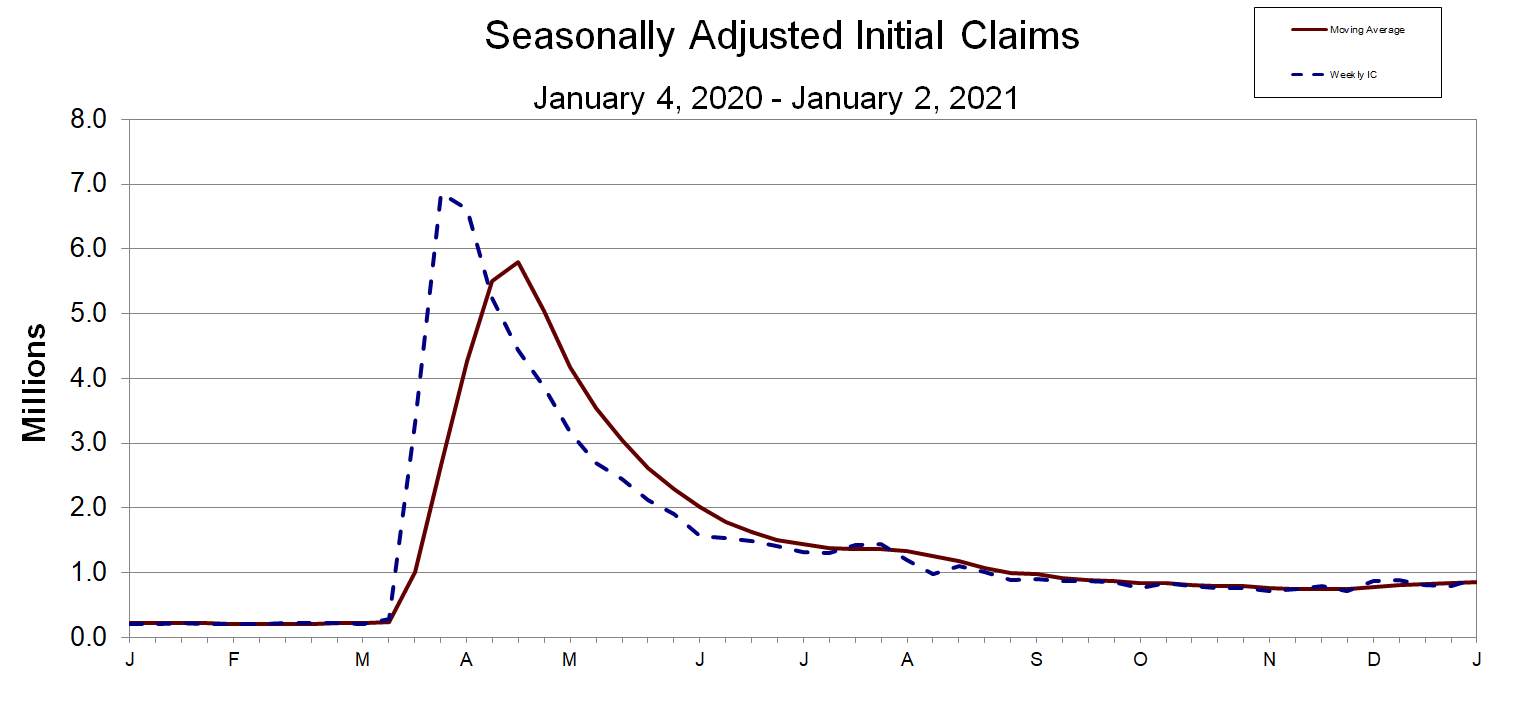
2020 U.S. Initial Jobless
Claims seasonally adjusted
insured unemployment claims
(Click on image for larger view)
The year ending at least 6 times worse
than it started.
-30-
Collected by students of
Zo^o University
Last updated
*
2021-02-03
Copyright
© 2021 Zo^o University
All Rights Reserved